HRV Instrumentation (1 Hour)
The electrocardiograph (ECG) and photoplethysmograph (PPG) are two methods of detecting heart rate (HR) and heart rate variability (HRV). A PPG sensor detects the pulse wave as it travels through the vascular tree. HRV estimates from pulse wave variability are termed pulse rate variability (PRV).
PRV may be a poor ECG surrogate for measuring HRV when participants stand or perform slow-paced breathing or have low HRV (Jan et al., 2019).
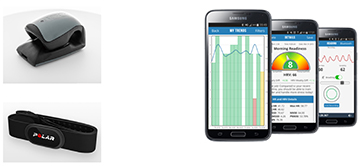
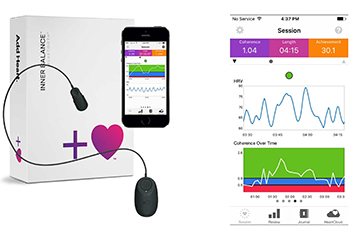
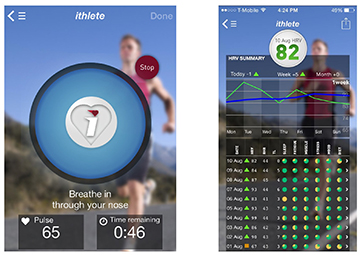
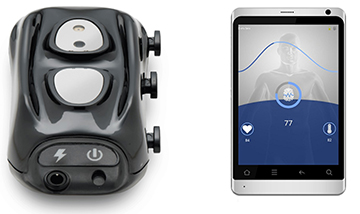
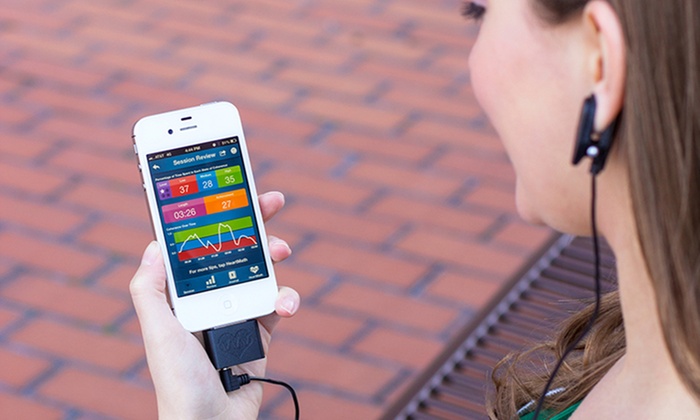
Consumer biofeedback devices that incorporate PPG sensors have become increasingly popular for recreation and self-regulation. Shown below are products by Elite HRV, HeartMath, myithlete, and Thought Technology Ltd.
 |
 |
 |
 |
BCIA Blueprint Coverage
This unit addresses HRV Instrumentation (1 hour) and covers Blood Volume Pulse and the Electrocardiogram (ECG/EKG).

This section covers the Source of BVP, PPG Sensor, BVP Signal, PPG Sensor Placement, BVP Artifacts, and Tracking Test.
A. BLOOD VOLUME PULSE
Source of BVP
Blood volume is the amount of blood contained in an area. This measure mainly reflects venous tone.
Listen to a mini-lecture on Blood Volume Pulse (BVP) © BioSource Software LLC.
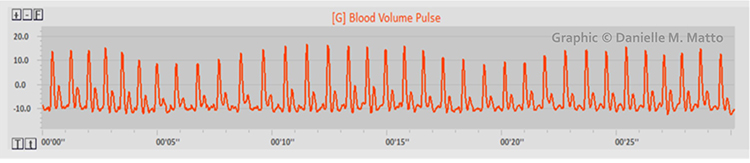
Blood volume pulse (BVP) indexes rapid changes in blood flow. It is calculated as the vertical distance between the minimum value of one pulse wave and the maximum value of the next. This measure mainly reflects blood flow and arteriolar tone (Peper, Shaffer, & Lin, 2010). Below is a BVP display. You can enlarge the video by clicking on the bracket icon at the bottom right of the screen. When finished, click on the ESC key.
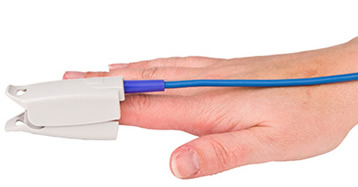
PPG Sensor
Blood volume pulse is detected using a photoplethysmograph (PPG). This device measures the relative amount of blood flow through tissue using a photoelectric transducer.
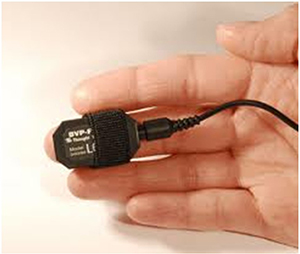
An infrared (7000-9000o A) light source is transmitted through or reflected off the tissue. The transmission technique places the light source and photodetector on the opposite sides of a digit (Matto, 2018).
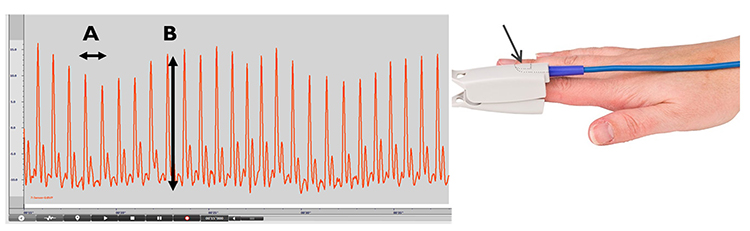
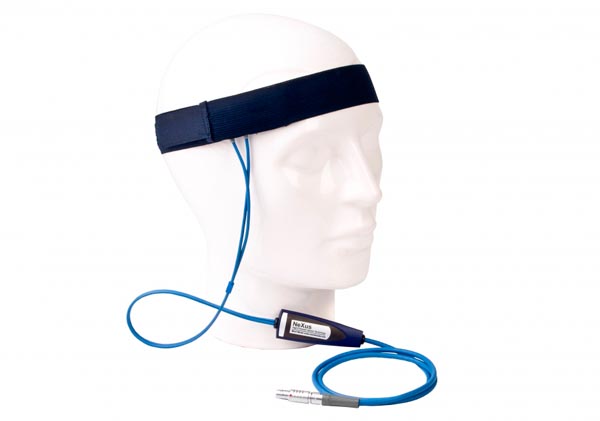
The reflection technique places both light source and photodetector on the same side of the tissue. In both methods, the intensity of the light reaching the sensor varies with momentary shifts in blood volume (Shaffer & Combatalade, 2013). The illustration below is courtesy of Thought Technology Ltd.
![]()
The interval between successive peaks (A) is called the interbeat interval (IBI). The peak-to-trough difference (B) shows the relative blood flow (Matto, 2018).
In transmission and reflectance modes, a photodetector detects and converts light into a positive DC signal.
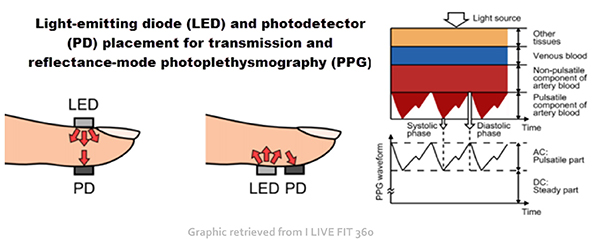
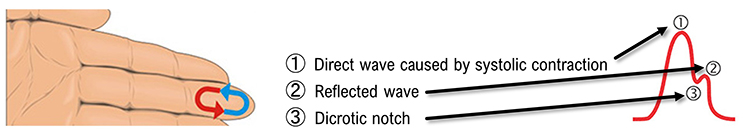
Blood appears red because it reflects red wavelengths. More light is reflected, and the BVP signal increases when the volume of blood increases. (1) As blood surges, more light is reflected, and the BVP signal peaks as the volume of blood increases. (2) As the pulse wave travels through the vascular tree, it is reflected by the lower body and appears as a second smaller peak. (3) The dicrotic notch is the gap between the direct and reflected waves.
The ear is less prone to artifact than the finger due to less movement, stronger signal, and less
risk of vasoconstriction due to temperature. Since the ear is closer to the heart than is the finger, there is less opportunity for the vascular tone rhythm to contaminate HRV frequency-domain measurements in the VLF, LF, and HF ranges (Lehrer, 2018b).
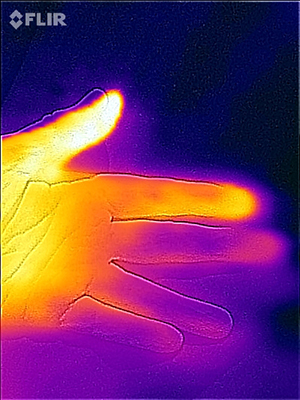
The thumb is an excellent site when a client's fingers are too small or have insufficient blood
flow to detect a strong pulse (Peper, Shaffer, & Lin, 2010). In the Flir infrared image below, the thumb is brighter than adjacent digits because of its greater perfusion with blood.
BVP Signal
When inspecting the raw blood volume pulse signal, a strong signal is a wave with a “sharp upswing and a longer downswing” (Garber, 1986). The peak should be slightly rounded. Measurement units are arbitrary and proportional to the sensor’s voltage output. An operational amplifier boosts the sensor’s DC output. The DC signal is then routed to an integrator for quantification.
Each heartbeat briefly increases blood volume in the arteries and capillary beds. The blood volume pulse signal can be used to calculate HR (beats per minute) by measuring the interbeat interval (the period between successive heartbeats). Divide the time interval between peaks by 60 seconds to calculate HR (Peper, Harvey, Lin, Tylova, & Moss, 2007).
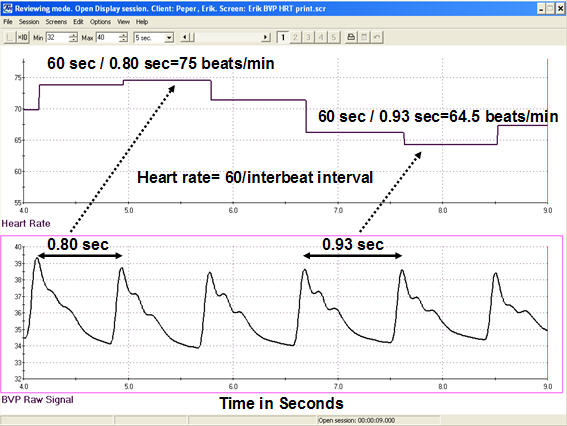
Caption: Heart rate is derived from blood volume measures by calculating the interbeat interval and then transforming this information into beats per minute. For example, the interbeat interval of 0.80 seconds is equal to a HR of 75 beats per minute, whereas the interbeat interval of 0.93 seconds is equal to a HR of 64.5.
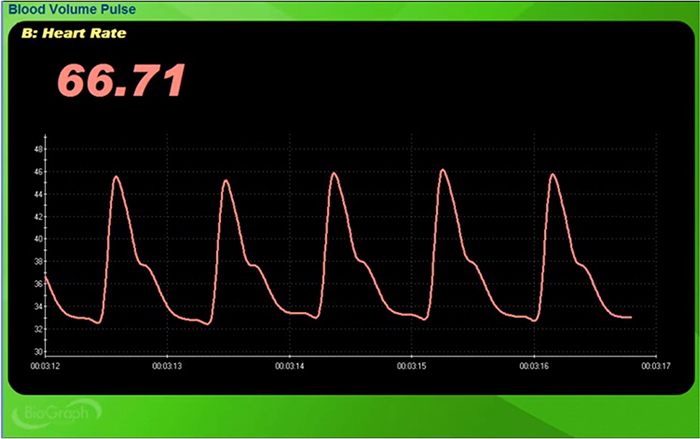
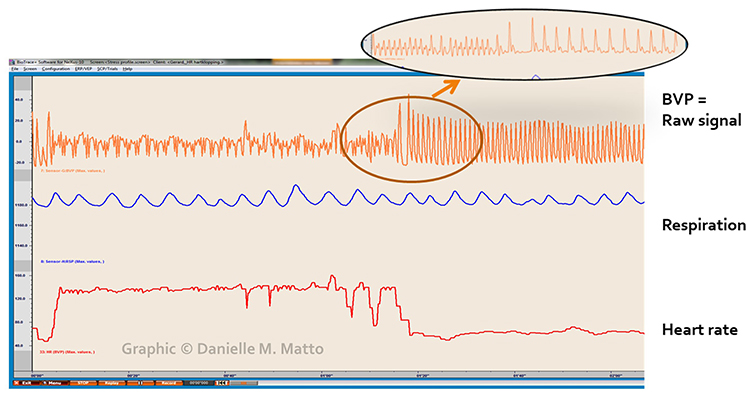
Clinicians may simultaneously monitor blood volume pulse, blood volume amplitude (relative volume of blood), HR, and respiration during training to increase HRV, as shown in the display below from Peper, Harvey, Lin, Tylova, and Moss (2007).
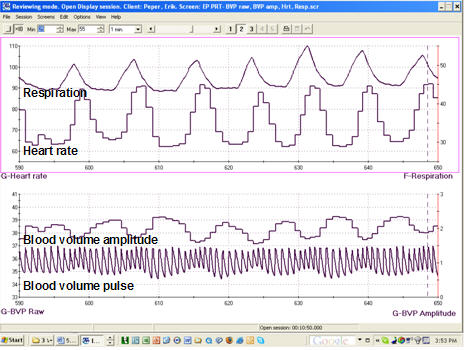
Caption: The data represent an average respiration rate of 7 breaths per minute with a corresponding HR of 73 beats per minute with a standard deviation of 10.1 beats.
Limitations to Photoplethysmography
There are four main limitations to blood volume pulse. First, this blood flow index only describes blood volume under the sensor. The blood volume in another area can be vastly different than in another.Second, blood volume pulse measurements are relative. Absolute values cannot be compared across different individuals as with hand temperature. However, values can be compared across a training session, and relative measures can be compared across individuals (Peper, Shaffer, & Lin, 2010).
Third, BVP and ECG methods may yield different HRV values with marked sympathetic activation. ECG values will be more accurate since they are not affected by vasoconstriction.
Finally, PRV may inflate HRV values and be a poor surrogate for ECG when participants stand or perform slow-paced breathing or have low HRV (Constant et al., 1999; Hemon & Phillips, 2016; Jan et al., 2019; Medeiros et al., 2011).
Advantages to Photoplethysmography
A photoplethysmograph can provide high-resolution feedback when temperature feedback shows minimal change. A PPG sensor is more sensitive to rapid blood volume changes. Blood volume pulse could easily drop 50-60% in a patient who is a vascular responder (fingers cool when challenged by stressors). When a client plateaus (ceases to warm), a clinician could switch to blood volume pulse biofeedback to increase hand-warming if the monitored hand is not significantly vasoconstricted.Skin Preparation
Unlike the ECG recording, minimal skin preparation is required since the PPG sensor detects infrared light instead of an electrical potential.Listen to a mini-lecture on BVP Skin Preparation © BioSource Software LLC.
Ask your clients to wash their hands so that dirt won’t occlude the sensor’s transducer window (Shaffer & Combatalade, 2013).

For PPG sensors that pass infrared light through the finger, instruct clients to avoid dark fingernail polish, which will block light transmission.

PPG Sensor Placement
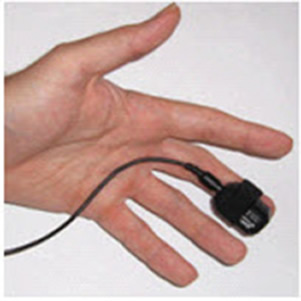
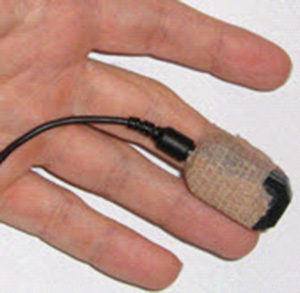
Photoplethysmograph sensor attachment is critical since readings are sensitive to limb position, 50/60Hz artifact, ambient light, movement, and pressure. For finger placements, attach the PPG sensor using a Velcro ® band or Coban™ tape to the palmar side of a larger finger (or thumb) and confine the sensor to only one finger segment.
Use the thumb when the fingers are small, or blood flow is compromised, such as when clients have cold hands (Peper, Shaffer, & Lin, 2010).
For
temporal artery placement, lightly press your first or second finger to
detect a pulse between the corner of the eye and eyebrow (near the
hairline). The best location will produce the highest amplitudes and
cleanest signals when displayed on a computer screen. A Mind Media BVP sensor is shown below.
Limb Position
Sensor position relative to the heart strongly affects blood volume pulse. If the PPG sensor is placed on a limb below the heart, BVP signal amplitude increases. We can take advantage of this phenomenon when signal amplitudes are weak (Lehrer, 2018b). If the limb is placed above the heart, the signal amplitude decreases. These changes appear to reflect venous filling (Peper, Shaffer, & Lin, 2010).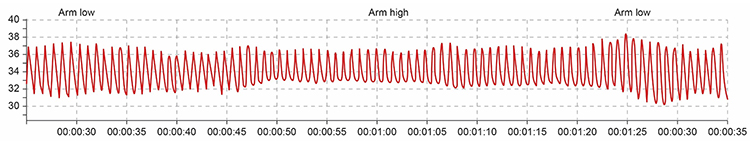
BVP Artifacts
Artifacts are false values produced by the client’s body (ectopic beats) and actions (movement), the environment (line current), and hardware limitations (light leakage).
Listen to a mini-lecture on BVP Artifacts © BioSource Software LLC.

Inspect the raw BVP signal for cardiac conduction, cold, light, line interference, movement, and pressure artifacts.

Rich Sherman has advised clinicians to:
1. use yourself as test equipment by knowing your typical values
2. perform a tracking test to ensure that the display mirrors clients’ psychophysiological performance
3. inspect the raw signal to detect contamination by artifact

Erik Peper has recommended that the best way to recognize artifacts using your equipment is to create them intentionally. See how they change the signal waveform and derived HRV statistics.

Adopt the proactive “close the barn door before the horse escapes” strategy. Where possible, prevent artifacts before you record data to avoid having to remove them later.

Use clean BVP recordings as a reference.
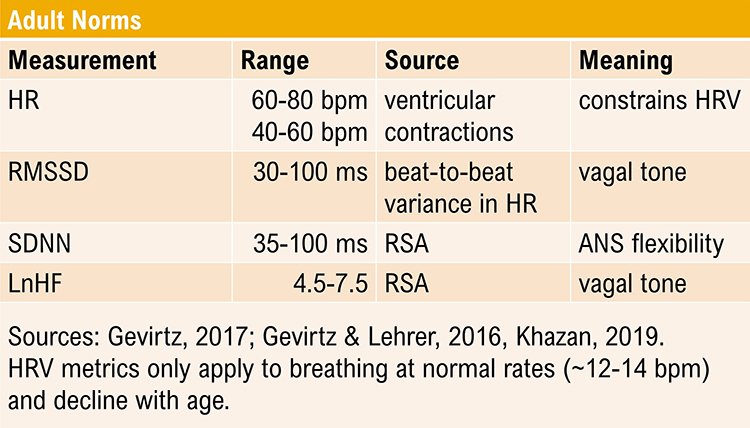
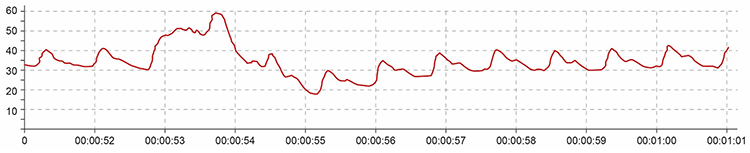
Short-Term HRV Values Are Proxies of 24-Hour Values
Recognize typical short-term (~ 5-minute) HR and HRV values to ensure that your readings make sense.Listen to a mini-lecture on Short-Term HRV Values Are Proxies © BioSource Software LLC.
Short-term values are proxies of 24-hour values. Never compare the short-term values shown below with 24-hour norms. Twenty-four-hour values are typically greater and can predict morbidity and mortality, while most short-term values cannot.
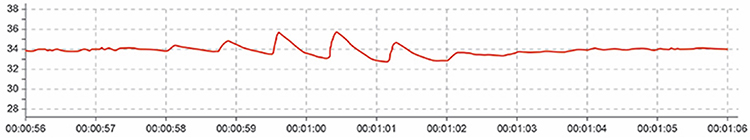
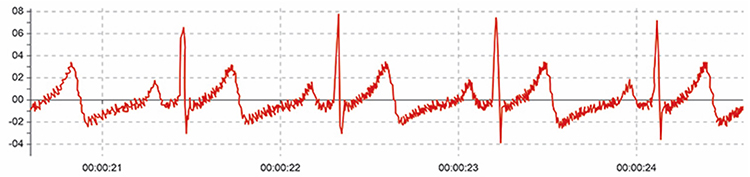
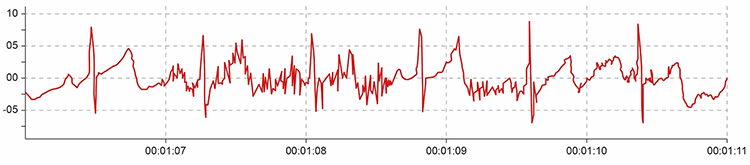
Cardiac Conduction Artifacts
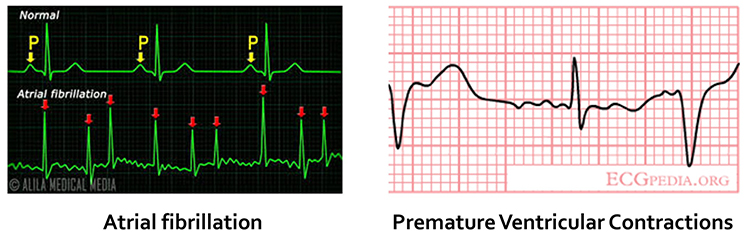
Cardiac conduction artifacts include atrial fibrillation, premature atrial contractions, and premature ventricular contractions.Atrial fibrillation is a form of supraventricular arrhythmia, with HRs reaching 160 beats per minute (Tortora & Derrickson, 2021).
Cardiac conduction is chaotic in clients who experience this disorder.
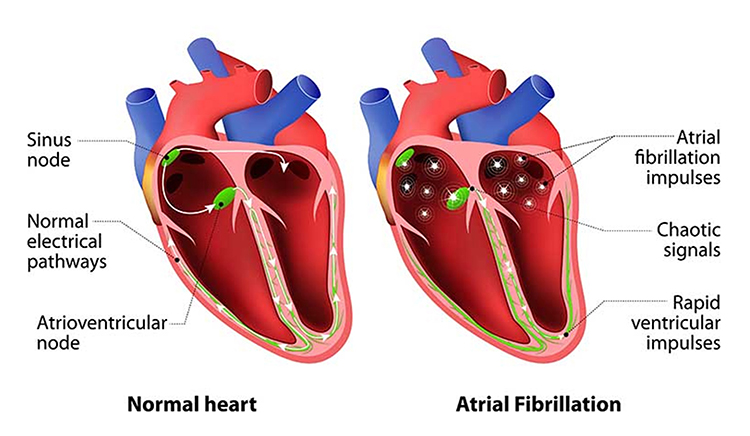
Atrial fibrillation appears as a low-amplitude BVP signal (see the left side of the enlarged view) with a faster HR.
Premature atrial contractions (PACs) involve early atrial contraction, are characterized by abnormally-shaped P-waves and result in calculating extra beats (Lehrer, 2018b).
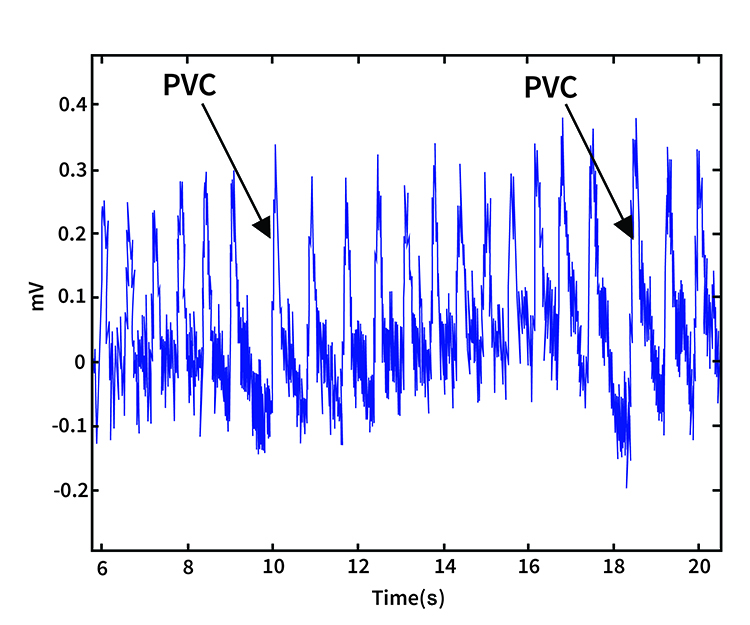
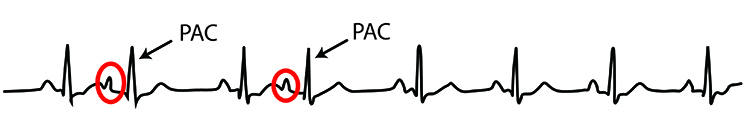 Premature ventricular contractions (PVCs) can result in an extra heartbeat followed by a full compensatory pause (Clinical ECG Interpretation, 2018).
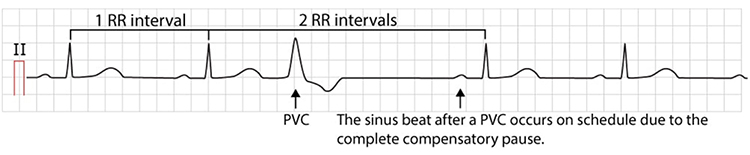
PVC artifacts are extra heartbeats that originate in the ventricles instead of the S-A node of the heart and can distort the BVP signal (Elgendi, 2012).
Clinical Tips to Minimize Cardiac Conduction Artifacts
Since atrial fibrillation, PAC, and PVC artifacts cannot be prevented, they must be eliminated by artifacting.
Cold Artifact
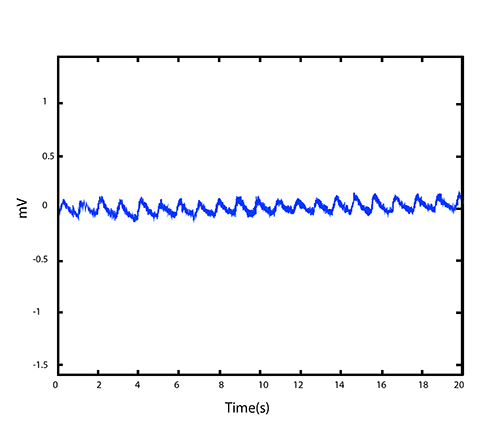
Cold artifact, produced by cold exposure or sympathetically-mediated vasoconstriction, can reduce or eliminate a pulse wave. Cold artifact may result in missed beats, resulting in artifactually-lengthened interbeat intervals (Shaffer & Combatalade, 2013).Listen to a mini-lecture on BVP Cold Artifact © BioSource Software LLC.
Here is a low-amplitude BVP signal (Elgendi, 2012).
Clinical Tips to Minimize Cold Artifact
1. Maintain at least a 74° F (23° C) room temperature.
2. Use an earlobe or thumb placement, or use an ECG sensor. Earlobe blood flow may produce an adequate BVP signal when you can’t detect a signal from the fingers. The thumb is an excellent site when a client's fingers are too small or have insufficient blood flow to detect a strong pulse (Peper, Shaffer, & Lin, 2010).
3. Position the hand below heart level (Lehrer, 2018b).
4. Provide your clients several minutes to relax.
5. Allow your clients to place their hands in a sink filled with warm water or in front of a space heater for several minutes.
6. Examine the raw signal for artifact.
Light Artifact
Light artifact occurs when ambient light overloads a PPG sensor’s photodetector producing large peak-to-trough differences (Cherif et al., 2016; Shaffer & Combatalade, 2013).Listen to a mini-lecture on BVP Light Artifact © BioSource Software LLC.
Clinical Tips to Minimize Light Artifact
1. Cover the PPG sensor with a baby sock, Coban™, a dark cloth, or Velcro ®.
2. Avoid direct illumination of the PPG sensor.
3. Instruct clients to restrict movement and verify compliance.
4. Examine the raw signal for artifact.
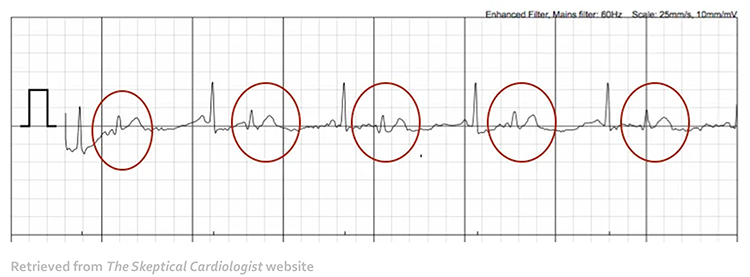
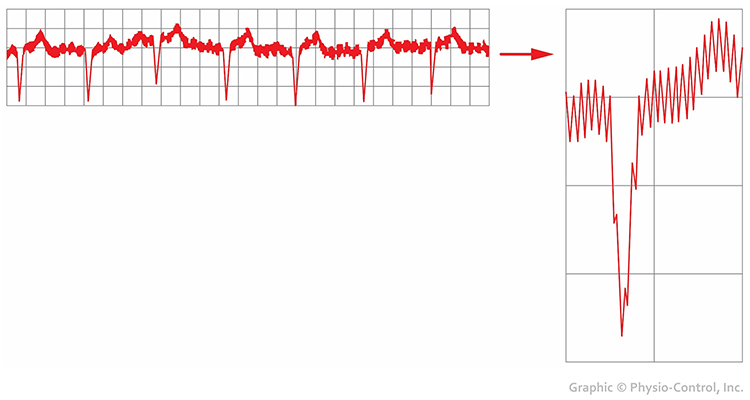
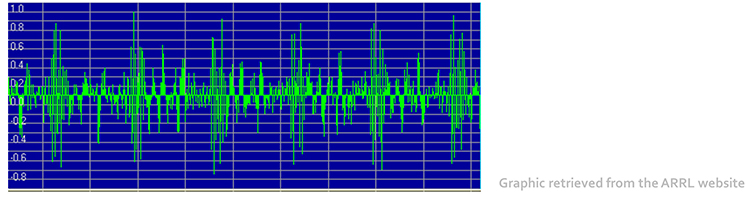
Line Interference (50/60 Hz) Artifact
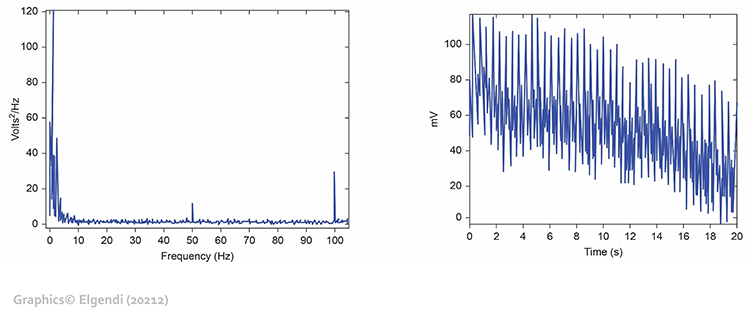
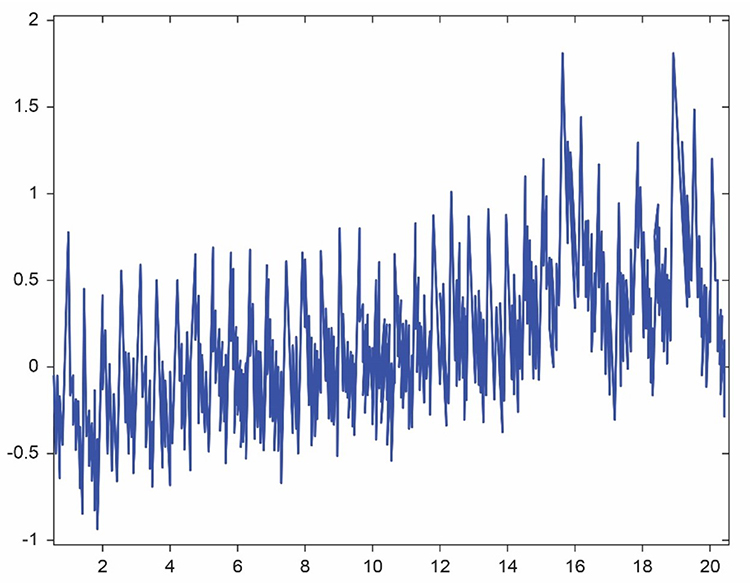
Line interference artifact appears as ripples during downswings in the raw blood volume pulse signal (Elgendi, 2012; Shaffer & Combatalade, 2013).Listen to a mini-lecture on BVP Line Interference Artifact © BioSource Software LLC.
You won't see it if your data acquisition system filters out the high-frequency component of the raw BVP signal before displaying it. The graphic below from Elgendi shows a 50-Hz peak and 100-Hz harmonic (left) and contamination of the raw BVP signal (right).
Clinical Tips to Minimize 50/60Hz Artifact
1. Use a 50/60Hz notch filter.
2. Place the encoder box 3 feet (1 meter) from electronic equipment.
3. Remove unused sensor cables from the encoder box.
4. Examine the raw signal for artifact.
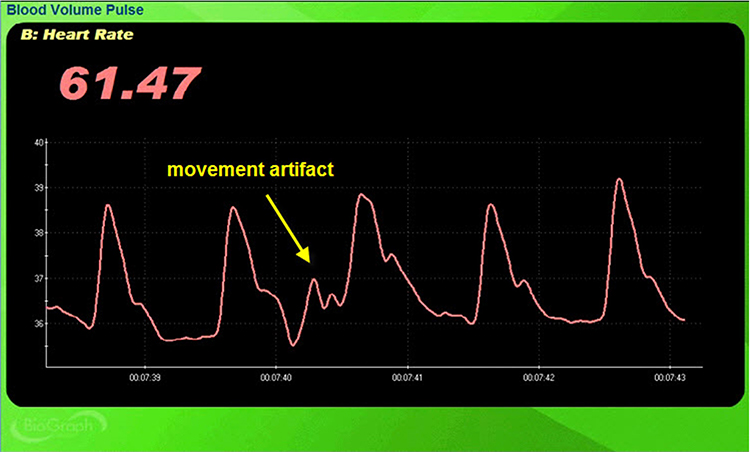
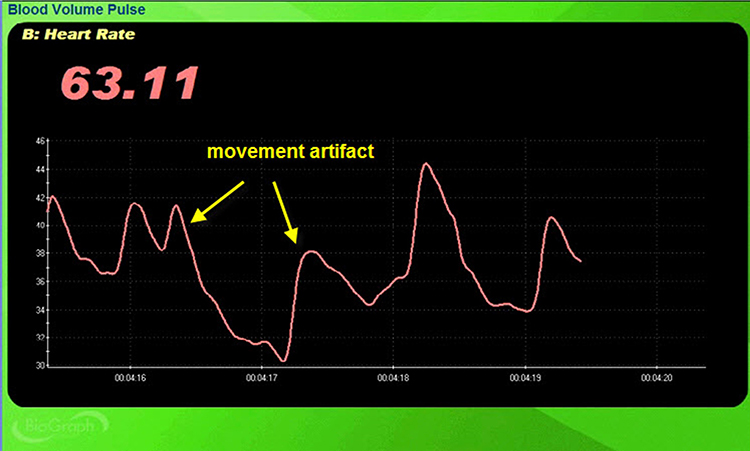
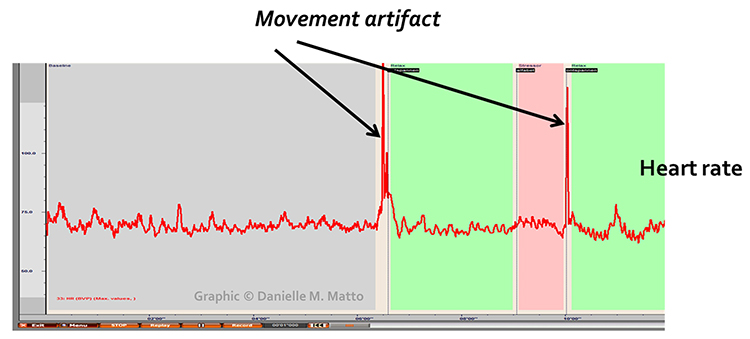
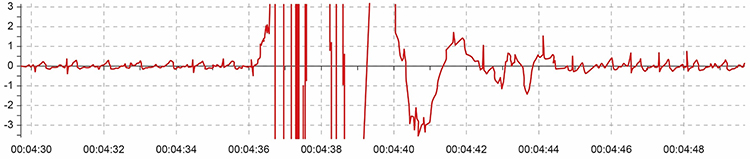
Movement Artifact
Sensor movement artifact is the leading cause of BVP signal distortion and can eliminate the signal or result in extra or missed beats (Elgendi, 2012; Shaffer & Combatalade, 2013).Listen to a mini-lecture on BVP Movement Artifact © BioSource Software LLC.
Sensor movement can interfere with infrared light transmission by the PPG sensor or allow contamination by ambient light.

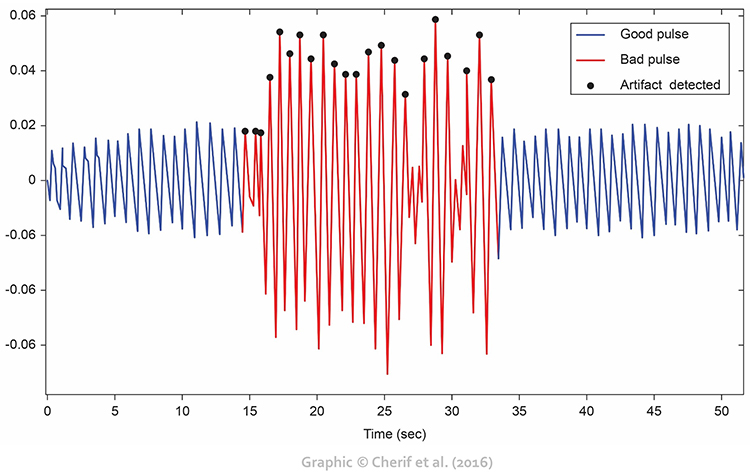
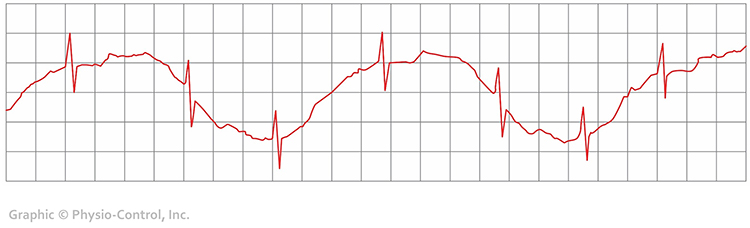
Movement artifacts are colored red in this graphic by Couceiro et al. (2014).
Inspection of the raw BVP can detect movement artifacts. Below is a display of movement artifacts. Note the appearance of ripples and distortion in the shape of the waveform. You can enlarge the video by clicking on the bracket icon at the bottom right of the screen. When finished, click on the ESC key.
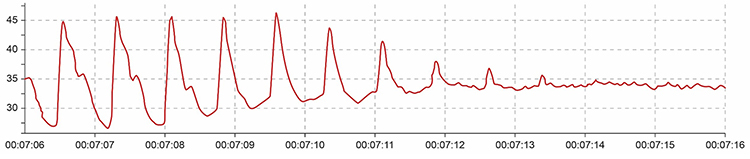
Movement artifact can distort the BVP waveform in different ways.
Standing and sitting can produce blood pressure-mediated upward and downward drifts. Arm movement above or below the heart can also generate drifts.
Repeated movements like finger tapping can create waveforms with ripples that resemble multiple notches.
The display may show sudden changes in the raw BVP signal and HR.
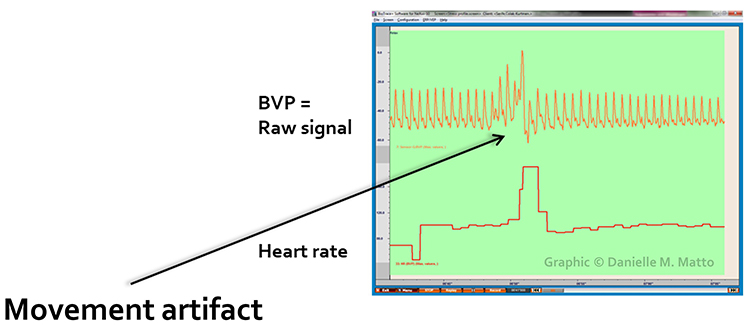
Below is a close-up view of sudden HR increases.
Clinical Tips to Minimize Movement Artifact
1. Firmly attach the PPG sensor to the client’s finger with hands resting on the knees.
2. Firmly tape sensor cables to client clothing for strain relief and cover the sensor with a baby sock or dark cloth to minimize the entry of ambient light.
3. A Velcro ® band should hold the PPG sensor in place without suppressing the pulse (Peper, Shaffer, & Lin, 2010). Alternatively, a mechanical housing can secure the sensor to the finger.
4. Instruct clients to minimize movement and monitor compliance.
5. Examine the raw signal for artifact.
Pressure Artifact
Pressure artifact can be caused by wrapping a restraining band too tightly.Listen to a mini-lecture on BVP Pressure Artifact © BioSource Software LLC.
Patients may report throbbing when a Velcro ® band is wrapped too tightly around a finger. Pressure can reduce raw signal amplitude, resulting in smaller values or a flat line, and may prevent detection of the peak of the pressure wave. Missed beats can lengthen IBIs and slow HRs (Shaffer & Combatalade, 2013).
Excessive pressure can also be caused by resting too much weight (e.g., hand pressing sensor against a knee or table) on the PPG sensor. Pressure artifact reduces the amplitude of the raw signal resulting in smaller values (Peper, Shaffer, & Lin, 2010).
Clinical Tips to Minimize Pressure Artifact
1. Readjust the tightness of the restraining band.
2. Keep pressure off the PPG sensor.
3. Examine the raw signal for artifact.
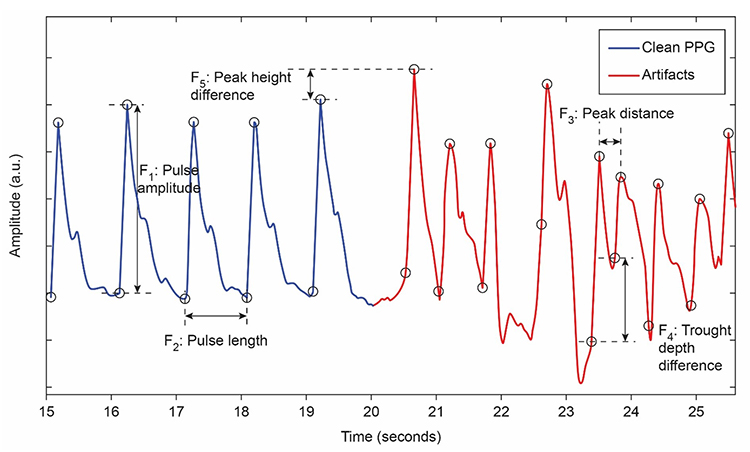
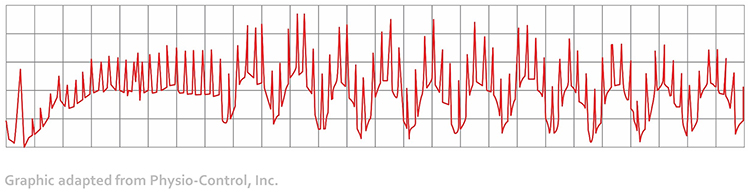
The graphic below from Elgendi (2012) shows multiple artifacts, including arrhythmia, EMG, low-amplitude, and movement, which can render an epoch unusable.
Tracking Test
You can determine whether the ECG or BVP signals respond to your client's breathing by observing whether their instantaneous HR speeds during inhalation and slows during exhalation.
Listen to a mini-lecture on the BVP Tracking Test © BioSource Software LLC.
BVP and Respiration Demonstration
Dr. Inna Khazan demonstrates BVP and respiration recording, artifacts, and a tracking test © Association for Applied Psychophysiology and Biofeedback. You can enlarge the video by clicking on the bracket icon at the bottom right of the screen. When finished, click on the ESC key.
HRV Myths

Misconception: BVP and ECG HRV measurements are interchangeable.
The BVP method may not be useable if participants are vasoconstricted and software cannot detect the peak of the pulse wave. It may inflate HRV estimates. PVR may be a poor proxy for HRV when participants stand or perform slow-paced breathing or have low HRV. Discount studies that report that PVR and HRV measurements are correlated if they don't report their measurement conditions (e.g., paced breathing) and limits of agreement (LOA; Shaffer, Meehan, & Zerr, 2020).

What should you do if the BVP signal is too weak to detect the peak of the pressure wave?
Shift the PPG sensor to the thumb or earlobe if placed on a finger. If you cannot record from the thumb because it is vasoconstricted, allow your client to warm the digit using relaxation, dipping the hands in a warm basin of water, or placing them in front of a space heater. If none of these options work, use the ECG method.
Glossary
blood volume pulse (BVP): the phasic change in blood volume with each heartbeat. It is the vertical distance between the minimum value (trough) of one pulse wave and the maximum value (peak) of the next measured using a photoplethysmograph (PPG).
cold artifact: cold exposure or sympathetically-mediated vasoconstriction that can reduce or eliminate a pulse wave.
electromagnetic interference (EMI) artifact: ECG and PPG artifact that is generated when cell phones transmit an artifactual voltage.
extra beats: ECG and PPG artifact that shortens the IBI when signal distortion causes software to detect nonexistent beats.
light artifact: PPG artifact when light leakage increases BVP amplitude.
line interference artifact: ECG and PPG artifact when 50/60Hz contamination of signals causes software to detect nonexistent beats and shorten the IBI.
missed beats: ECG and PPG artifact that lengthens the IBI when signal distortion causes software to overlook a beat and use the next good beat.
movement artifact: ECG and PPG artifact that shortens the IBI when signal distortion from movement causes software to detect nonexistent beats.
photoelectric transducer: phototransistor that detects infrared light transmitted by a PPG sensor and converts it into a positive DC signal.
photoplethysmographic sensor: a photoelectric transducer that transmits and detects infrared light that passes through or is reflected off tissue to measure brief changes in blood volume and detect the pulse wave.
pressure artifact: reduction in the amplitude of the BVP signal due to a tight restraining band or resting too much weight on the PPG sensor.
pulse rate variability (PRV): a proxy of HRV derived from the BVP signal.
tracking tests: checks of whether the biofeedback display mirrors client behavior. BVP amplitude should increase and then decrease as a hand is raised above the heart and then dropped below the heart.
REVIEW FLASHCARDS ON QUIZLET
Click on the Quizlet logo to review our chapter flashcards.

Essential Skills
Blood volume pulse
1. Explain the blood volume pulse signal and biofeedback to a client.
2. Explain PPG sensor attachment to a client and obtain permission to monitor her.
3. Explain how to select a placement site and demonstrate how to attach a PPG sensor to minimize light and movement artifacts.
4. Perform a tracking test by asking your client to raise the monitored hand above the heart and then it.
5. Identify common artifacts in the raw PPG signal, especially movement, and explain how to control for them and remove them from the raw data.
6. Explain the major measures of heart rate variability, including HR Max - HR Min, pNN50, SDNN, and SDRR.
7. Explain why we train clients to increase power in the low-frequency band of the ECG and how breathing at 5-7 breaths per minute helps them accomplish this.
8. Demonstrate how to instruct a client to utilize a feedback display.
9. Describe strategies to help clients increase their heart rate variability.
10. Demonstrate an HRV biofeedback training session, including record keeping, goal setting, site selection, baseline measurement, display and threshold setting, coaching, and debriefing at the end of the session.
11. Demonstrate how to select and assign a practice assignment based on training session results.
12. Evaluate and summarize client/patient progress during a training session.
Assignment
Now that you have completed this module, how would you explain how a PPG sensor detects a heartbeat? How do you control movement artifact?
Acknowledgment
This unit draws heavily on graphics published in Didier Combatalade’s Basics of Heart Rate Variability Applied to Psychophysiology, published by Thought Technology Ltd. Didier is the Director of Clinical Interface at Thought Technology Ltd and is a gifted educator and writer, and generous colleague.

References
Andreassi, J. L. (2000). Psychophysiology: Human behavior and physiological response. Lawrence Erlbaum and Associates, Inc.
Berntson, G. G., Quigley, K. S., & Lozano, D. (2007). Cardiovascular psychophysiology. In J. T. Cacioppo, L. G. Tassinary, & G. G. Berntson (Eds.). Handbook of psychophysiology (3rd ed.). Cambridge University Press.
Combatalade, D. (2010). Basics of heart rate variability applied to psychophysiology. Thought Technology Ltd.
Constant, I., Laude, D., Murat, I., & Elhhozi, J.-L. (1999). Pulse rate variability is not a surrogate for heart rate variability. Clinical Science, 97(4), 391–397. https://doi.org/10.1042/cs0970391.
Elgendi, M. (2012). On the analysis of fingertip photoplethysmogram signals. Current Cardiology
Reviews, 8, 14-25. https://dx.doi.org/10.2174%2F157340312801215782
Gevirtz, R. N. (2011). Cardio-respiratory psychophysiology: Gateway to mind-body medicine. BFE conference workshop.
Hemon, M. C., & Phillips, J. P. (2016). Comparison of foot finding methods for deriving instantaneous pulse rates from photoplethysmographic signals. Journal of Clinical Monitoring and Computing, 30(2), 157–168. https://doi.org/10.1007/s10877-015-9695-6.
Jan, H.-Y., Chen, M.-F., Fu, T.-C., Lin, W.-C., Tsai, C.-L., & Lin, K.-P. (2019). Evaluation of coherence between ECG and PPG derived parameters on heart rate variability and respiration in healthy volunteers with/without controlled breathing. Journal of Medical and Biological Engineering, 39, 783-795. https://doi.org/10.1007/s40846-019-00468-9
Lehrer, P. M. (2012). Personal communication.
Medeiros, R. F., Silva, B. M., Neves, F. J., Rocha, N. G., Sales, A. R. K., & Nobrega, A. C. (2011). Impaired hemodynamic response to mental stress in subjects with prehypertension is improved after a single bout of maximal dynamic exercise. Clinics, 66(9), 1523–1529. https://doi.org/10.1590/S1807-59322011000900003.
Montgomery, D. (2004). Introduction of biofeedback. Module 3: Psychophysiological recording. A. Crider & D. D. Montgomery (Eds.). Association for Applied Psychophysiology and Biofeedback.
Moss, D. (2004). Heart rate variability (HRV) biofeedback. Psychophysiology Today, 1, 4-11.
Nunan, D., Sandercock, G. R. H., & Brodie, D. A. (2010). A quantitative systematic review of normal values for short-term heart rate variability in healthy adults. Pacing and Clinical Electrophysiology, 33(11), 1407-1417. https://doi.org/10.1111/j.1540-8159.2010.02841.x
Peper, E. (2010). Personal communication.
Peper, E., Harvey, R., Lin, I., Tylova, H., & Moss, D. (2007). Is there more to blood volume pulse than heart rate variability, respiratory sinus arrhythmia, and cardio-respiratory synchrony? Biofeedback, 35(2), 54-61.
Peper, E., & Lin, I.-M. (2009). Keep cell phones and PDAs away from EMG sensors and the human body to prevent electromagnetic interference artifacts and cancer. Biofeedback, 37(3), 114-116. https://doi.org/10.5298/1081-5937-37.3.114
Peper, E., Shaffer, F., & Lin, I-M. (2010). Garbage In; Garbage out—Identify blood volume pulse (BVP) artifacts before analyzing and interpreting BVP, blood volume pulse amplitude, and heart rate. Biofeedback, 38(1), 19-23. https://doi.org/10.5298/1081-5937-38.1.19
Shaffer, F., & Combatalade, D. C. (2013). Don't add or miss a beat: A guide to cleaner heart rate variability recordings. Biofeedback, 41(3), 121-130. https://doi.org/10.5298/1081-5937-41.3.04
Shaffer, F., Meehan, Z. M., & Zerr, C. L. (2020). A critical review of ultra-short-term heart rate variability norms research. Frontiers in Neuroscience. https://doi.org/10.3389/fnins.2020.594880
Shaffer, F., & Moss, D. (2006). Biofeedback. In Y. Chun-Su, E. J. Bieber, & B. Bauer (Eds.). Textbook of complementary and alternative medicine (2nd ed.). Informa Healthcare.
Stern, R. M., Ray, W. J., & Quigley, K. S. (2001). Psychophysiological recording (2nd ed.). Oxford University Press.
Task Force of the European Society of Cardiology and the North American Society of Pacing and Electrophysiology (1996). Heart rate variability: Standards of measurement, physiological interpretation, and clinical use. Circulation, 93, 1043-1065. PMID: 8598068
B. THE ELECTROCARDIOGRAM (ECG/EKG)
The electrocardiogram provides the most accurate measurement of heart rate and heart rate variability. Clinicians need to recognize clean signals, identify significant artifact sources, and understand how to prevent them. A tracking test helps ensure that your data acquisition system faithfully displays changes in client HRV.

This section covers the Source of the ECG, ECG Sensors, ECG Signal, ECG Sensor Placement, ECG Artifacts, and Tracking Tests.
Source of the ECG Signal
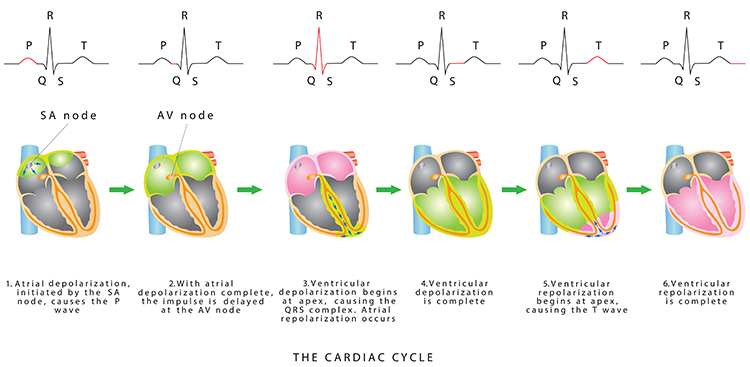
In a healthy heart, the SA node initiates each cardiac cycle by spontaneously depolarizing its autorhythmic fibers. The SA node's firing of 60-100 action potentials per minute usually prevents slower parts of the conduction system and myocardium (heart muscle) from generating competing potentials. Graphic © Alila Medical Media/Shutterstock.com.
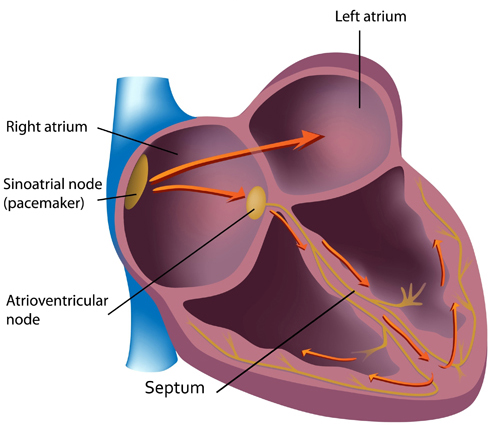
The SA node fires an impulse that travels through the atria to the AV node in about 0.03 seconds and causes the AV node to fire. The P wave of the ECG is produced as contractile fibers in the atria depolarize. The P wave culminates in the contraction of the atria (atrial systole). Animation © 2010 Scholarpedia.
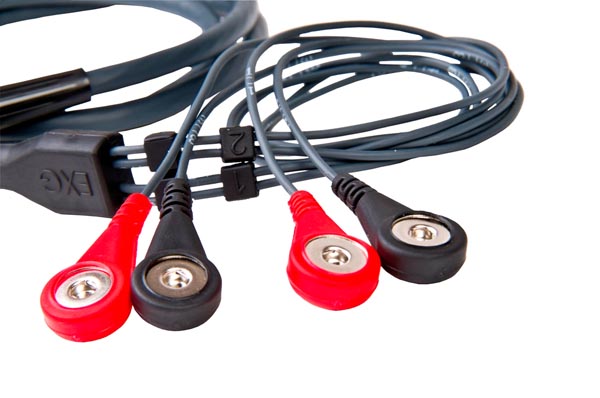
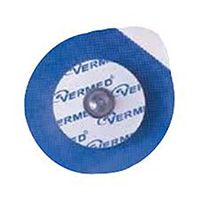
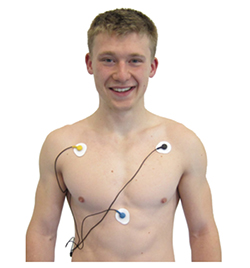
ECG Sensors
Three- or four-lead electrode assemblies are sufficient to record the ECG signal. There is no universal color-coding system for ECG electrodes (Lehrer, 2018b). ECG sensors can be identical to EMG sensors. Standard lead cables have snap buttons onto which the electrodes are affixed. An sensor is shown below.
Dry or gelled electrodes can be used. Pre-gelled disposable ECG electrodes save preparation time and reduce the risk of infection.
Skin Preparation
Prepare the skin by rubbing the area where the electrodes will be applied with an alcohol wipe. Cleaning the skin of oil and dirt helps reduce impedance, which is the opposition to AC flow. You may need to shave the chest and abdomen if body hair prevents satisfactory electrode contact with the skin for men. The multi-lead configuration shown below is used for diagnostic ECGs and not HRV biofeedback. Graphic © Bork/Shutterstock.com.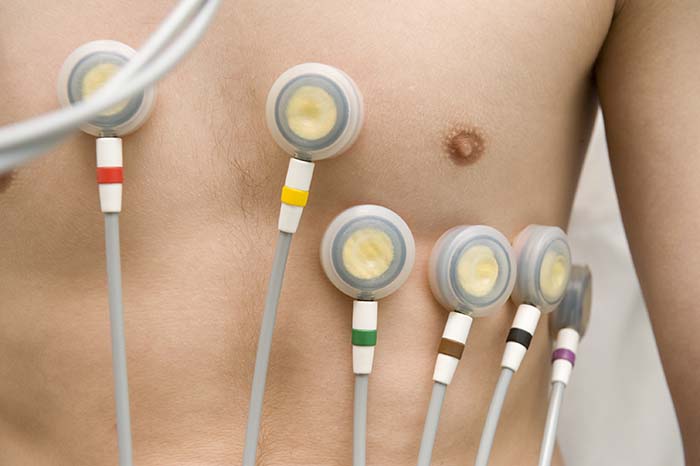
ECG Signal
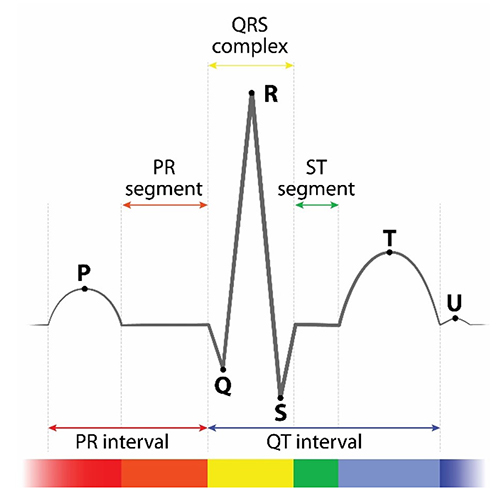
The signal from the SA node rapidly spreads through the atrioventricular (AV) bundle reaching the top of the septum. Descending right and left bundle branches conduct the action potential over the ventricles about 0.2 seconds after the appearance of the P wave.
Conduction myofibers extend from the bundle branches into the myocardium, depolarizing contractile fibers in the ventricles (lower chambers). Ventricular depolarization generates the QRS complex. The software uses the R-spike (depicted below at 3) to detect a heartbeat and measure the IBI.
The ventricles contract (ventricular systole) soon after the emergence of the QRS complex. Their contraction continues through the S-T segment. Ventricular contractile fiber depolarization generates the T wave about 0.4 seconds following the P wave. The ventricles relax (ventricular diastole) 0.6 seconds after the P wave begins (Tortora & Derrickson, 2021).
Check out the YouTube video 15 Second EKG. Graphic © lotan/Shutterstock.com.
Placements
Six standard ECG electrode placements can be used. These include the wrist, wrist-to-ankle, forearm, lower torso, and chest (upper chest/xiphoid; heart level). These placements differ in vulnerability to skeletal muscle (EMG) or movement artifact, speed of application, and degree of client comfort.
Listen to a mini-lecture on Six ECG Placements © BioSource Software LLC.
ECG recording is vulnerable to diverse artifacts. Missing or extra beats may be caused by abnormal cardiac conduction and line current interference, EMG, movement, DC offset, electromagnetic (EMI), and electrode polarity artifacts.
Wrist Placement
A wrist placement requires electrode straps instead of adhesive electrodes. One strap is used to attach an active electrode to the right wrist and the other to attach the reference and second active electrode to the left wrist. While the easiest, most socially comfortable, and quickest ECG electrode placement, it is highly vulnerable to arm EMG artifact and movement artifact.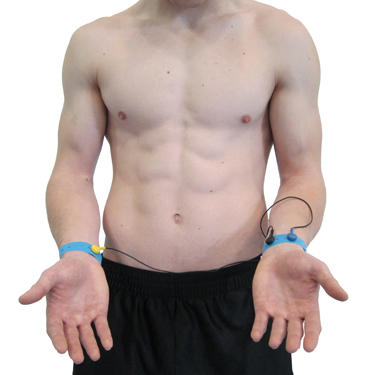
Wrist-to-Ankle Placement
Place the active (+) electrodes on the left wrist and ankle and the reference (-) electrode on the right wrist.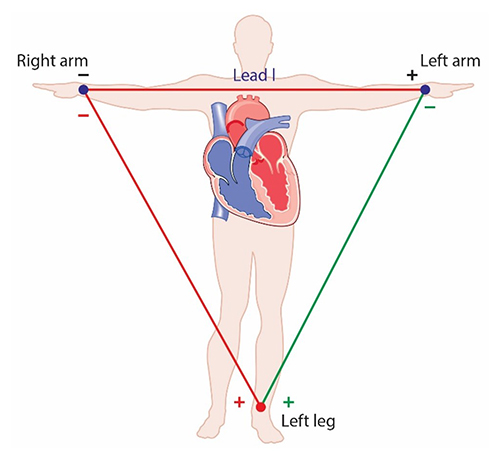
The right arm to left leg placement often accentuates the R-spike in individuals with large T-waves and is less invasive than chest or lower torso placements. This placement is more vulnerable to movement artifacts than the chest or lower torso placement (Lehrer, 2018). Graphic © Designua/Shutterstock.com.
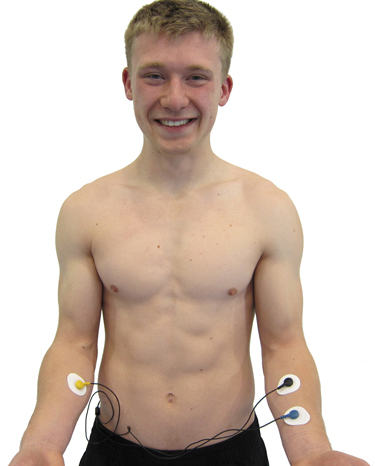
Forearm Placement
A forearm placement locates an active electrode on the right forearm and the reference and secondactive electrodes on the left forearm. Select an area with minimal or no hair. This placement is more vulnerable to contamination by arm and chest EMG artifact and movement artifact.
Lower Torso Placement
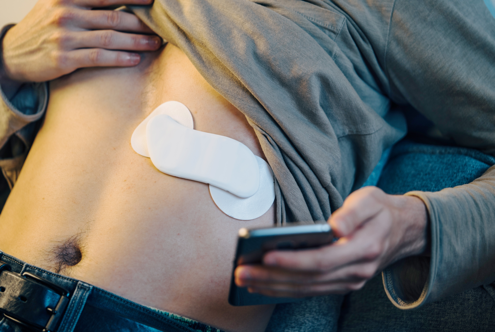
A lower torso placement suggested by Peper (2010) centers the reference electrode over the angle of the sternum and the active electrodes about 5 centimeters above the navel and 10 centimeters to the left and right of the midline. This placement provides an alternative for clients who are uncomfortable exposing their chests (they can lift their blouse or shirt) and is less vulnerable to arm EMG artifact and movement artifacts..jpg)
Chest Placement
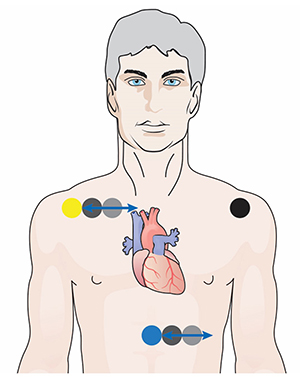
A chest placement locates active and reference electrodes over the right and left coracoid processes,respectively, and a second active electrode over the xiphoid process. This placement reduces the risk of arm muscle artifact but exposes the chest area, which can be uncomfortable for female clients (Shaffer & Combatalade, 2013).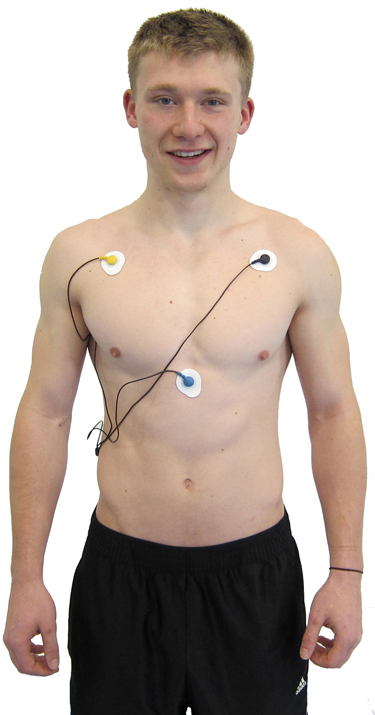
An alternative chest placement locates all three electrodes in a row at heart level. This sensor arrangement can detect the largest-amplitude R-spikes (Lehrer, 2018b).
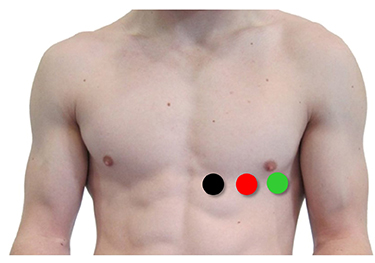
The Lief Therapeutics sensor uses this placement. Graphic © Lief Therapeutics.
Placement Summary
Wrist or forearm placements offer greater client comfort and quicker application speeds where EMG and movement artifacts don't contaminate your recordings. The lower torso placement may be best for research when these artifacts are present. Sensor placement on the upper chest and abdomen requires client/participant education and written informed consent.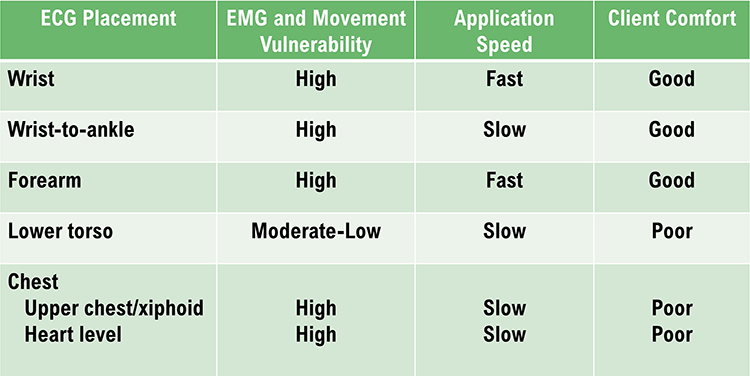
Review the ECG
Click on the graphic below to review the ECG Quizlet set by Stephanie Verbeek.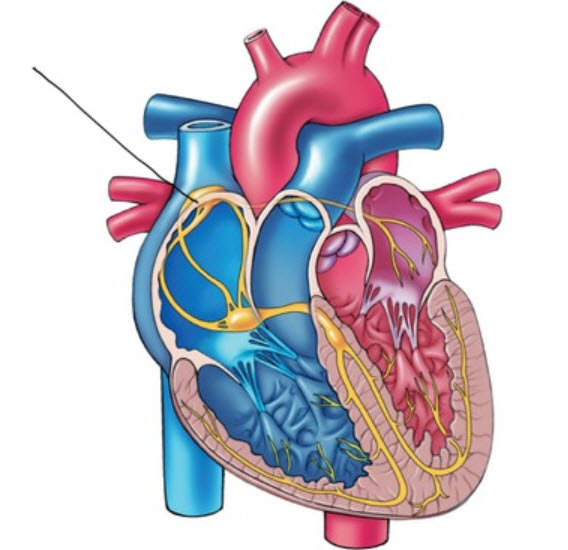
ECG Artifacts
ECG recording is vulnerable to diverse artifacts. Missing or extra beats, 50/60Hz noise, EMG, respiration, movement, DC offset, electromagnetic (EMI), and electrode polarity produce the most important artifacts.
Missed and Extra Beats
HRV software determines the interbeat interval (IBI) by detecting adjacent beats and measuring the time between R-spikes.Listen to a mini-lecture on Missed and Extra Beats © BioSource Software LLC. Graphic © arka38/Shutterstock.com.
After detecting the first beat, the software starts counting and calculates the first IBI in milliseconds. This process is repeated until the end of the epoch or data collection period. Graphic courtesy of Dick Gevirtz.
IBI measurements are the basis of statistical calculations of time-domain (pNN50, RMSSD, and SDNN), frequency-domain (VLF, LF, and HF), and nonlinear measurements.
As with BVP, use clean ECG recordings as a reference. Graphic © Aldini.
HRV artifacts can be produced by physiological events like atrial fibrillation and premature ventricular contractions (PVCs) or signal distortion.
When prevention fails and artifacts contaminate your recordings, clean-up is critical because a single artifactual IBI value in a 2-minute epoch can markedly distort time- and frequency-domain measurements (Berntson et al., 1997).
Discard a segment when more than 5% of IBI values are corrupted. Depending on the frequency of conduction abnormalities, you may not be able to analyze a contaminated data record.
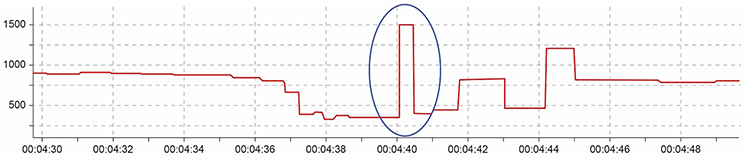
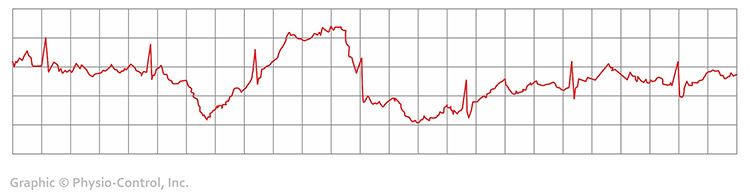
When distortion prevents software from detecting a heartbeat, this results in a missed beat and a prolonged interbeat interval (IBI) calculation. On the graph below, a missed beat generated the circled IBI (1500 ms).
Conversely, when distortion causes the software to detect an extra beat, this produces an artifactually short interbeat interval (IBI). As emphasized earlier, missed and extra beats also affect PPG recording (Elgendi, 2012).
Inspect the raw ECG signal for line interference, EMG, movement, DC offset, electromagnetic interference, radiofrequency, and polarity artifacts.
Line Interference (50/60 Hz) Artifact
Line interference artifact is the most frequent source of ECG signal contamination.Listen to a mini-lecture on ECG Line Interference Artifact © BioSource Software LLC.
It doesn’t affect the BVP signal because it is based on back-scattered or transmitted infrared light. Primary sources of this artifact include computers, computer monitors, fluorescent lights, and power outlets. The line interference artifact looks fuzzy because high-frequency fluctuations are superimposed on the signal (Shaffer & Combatalade, 2013).
Clinical Tips to Minimize Line Interference (50/60Hz) Artifact
1. Use a 50/60Hz notch filter.
2. Place the encoder box 3 feet (1 meter) from electronic equipment.
3. Remove unused sensor cables from the encoder box.
4. Carefully prepare the skin.
5. Apply pre-gelled electrodes to achieve low and balanced impedances (10 Kohms/5 Kohms).
6. Examine the raw signal for artifacts.
EMG Artifact
Frequencies generated by the depolarization of skeletal muscles overlap with the ECG spectrum and produce EMG artifacts.Listen to a mini-lecture on ECG EMG Artifact © BioSource Software LLC.
The surface EMG ranges from 1-1,000 Hz (Stern, Ray, & Quigley, 2001), while the ECG extends from 0.1-1,000 Hz (Langner & Geselowitz, 1960). Muscle action potentials from large muscle groups travel to ECG sensors via the process of volume conduction (Shaffer & Neblett, 2010).
Contraction of muscles in the arm can cause the software to "see" many extra beats and calculate shorter IBIs (Shaffer & Combatalade, 2013).
While EMG artifact affects ECG recordings, it does not contaminate the BVP signal since we detect it using infrared light.
Clinical Tips to Minimize Electromagnetic Interference Artifacts1. Use chest or lower rib placements instead of forearm or wrist placements.
2. Instruct your client to sit in a relaxed position and restrict movement, and verify compliance.
3. Examine the raw signal for artifacts.
Movement Artifact
Client movement can pull the electrode cable so that the electrode partially (or completely) loses contact with the skin.Listen to a mini-lecture on ECG Movement Artifact © BioSource Software LLC.
Movement artifact consists of high-amplitude signal fluctuations that cause the software to "see“ many extra beats and calculate shorter IBIs as with EMG artifact.
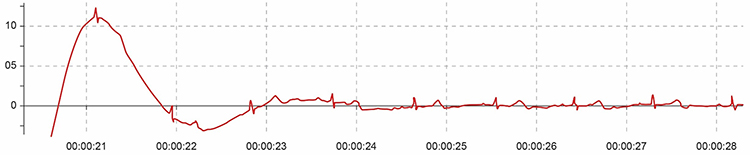
Below is a display of movement artifact. The ECG (also called EKG) waveform abruptly shifts upward after the sixth heartbeat and then returns to normal. You can enlarge the video by clicking on the bracket icon at the bottom right of the screen. When finished, click on the ESC key.
Clinical Tips to Minimize Movement Artifact
1. Firmly tape sensor leads to client clothing for strain relief to restrict movement.
2. Use a lower torso placement.
3. Use pre-gelled electrodes to ensure strong skin-electrode contact.
4. Provide instructions to sit in a relaxed position and restrict movement, and confirm compliance.
5. Examine the raw signal for artifacts.
Respiration Artifact
Respiration artifacts can result from dried gel and inadequate skin preparation.Listen to a mini-lecture on ECG Respiration Artifact © BioSource Software LLC.
Clinical Tips to Respiration Artifact
1. Abrade the skin after cleaning with an alcohol wipe.
2. Use pre-gelled electrodes to ensure strong skin-electrode contact.
Direct Current (DC) Offset Artifact
DC offset artifact occurs when the skin-electrode impedances of the three ECG electrodes differ due to poor skin-electrode contact.Listen to a mini-lecture on ECG Direct Current Offset Artifact © BioSource Software LLC.
The ECG signal may drift up or down, causing extra beats or missed beats.
Clinical Tips to Minimize DC Offset Artifact
1. Clean the skin using an alcohol wipe.
2. Use fresh electrodes with sufficient gel.
3. Examine the raw signal for artifacts.
Electromagnetic Interference (EMI) Artifacts
Electromagnetic interference (EMI) artifacts are generated by cell phones when they are less than 6 ft (2 m) from ECG sensors or encoder boxes (Peper & Lin, 2010).Listen to a mini-lecture on ECG Electromagnetic Interference Artifacts © BioSource Software LLC.
Computer monitors and television screens are sources of EMI artifacts. These are also called radiofrequency (RF) artifacts. High-frequency energy expands outward from a monitor like a cone (Montgomery, 2004).
Also, watch out for audiovisual systems and high-voltage equipment like centrifuges, elevators, and x-ray machines (Lehrer, 2018b).
Clinical Tips to Minimize Electromagnetic Interference Artifacts
1. Ensure that all cell phones are turned off.
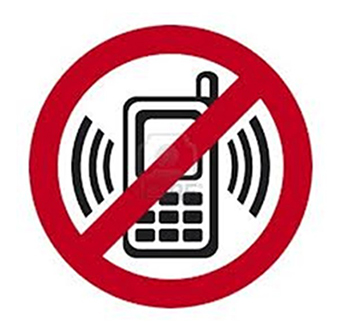
2. Maintain an adequate distance from high-voltage equipment (Lehrer, 2018b).
3. Position an encoder box or separate instruments behind or to the side of the monitor.
4. Place the client no closer than 2-3 feet from the monitor (Montgomery, 2004).
Polarity Artifact
Polarity artifact occurs when the active electrodes (yellow and blue for Thought Technology) are misaligned with respect to the heart’s axis.Listen to a mini-lecture on ECG Polarity Artifact © BioSource Software LLC.
A low-amplitude downward-oriented R-spike can cause the software to miss beats and lengthen the IBI.
Software packages like J & J Engineering’s Physiolab automatically correct for polarity artifact (Lehrer, 2018b).
Clinical Tips to Minimize Polarity Artifact
1. Locate active electrodes on the right shoulder and over the xiphoid process (extension of the lower sternum).
2. Laterally adjust electrode position to increase R-spike amplitude.
3. The best location may require experimentation.
Tracking Test
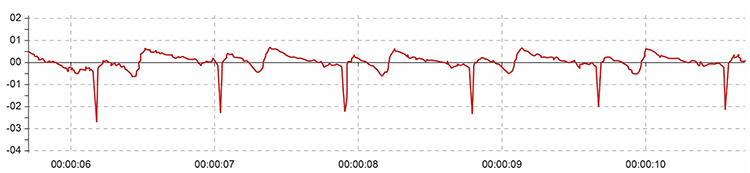
Using a respirometer, you can determine whether the ECG signal responds to your client's breathing by observing whether instantaneous HR speeds during inhalation and slows during exhalation (gray line) (Nederend et al., 2016).
Listen to a mini-lecture on the ECG Tracking Test © BioSource Software LLC.
The display below shows that instantaneous HR (pink) speeds and slows as the abdominal strain gauge (purple) rhythmically expands and contracts. You can enlarge the video by clicking on the bracket icon at the bottom right of the screen. When finished, click on the ESC key.
ECG and Respiration Demonstration
Dr. Inna Khazan demonstrates ECG and respiration recording, artifacts, and a tracking test © Association for Applied Psychophysiology and Biofeedback. You can enlarge the video by clicking on the bracket icon at the bottom right of the screen. When finished, click on the ESC key.